Dashboards & Analytics for SAP Software:
Better Visibility, Better Results

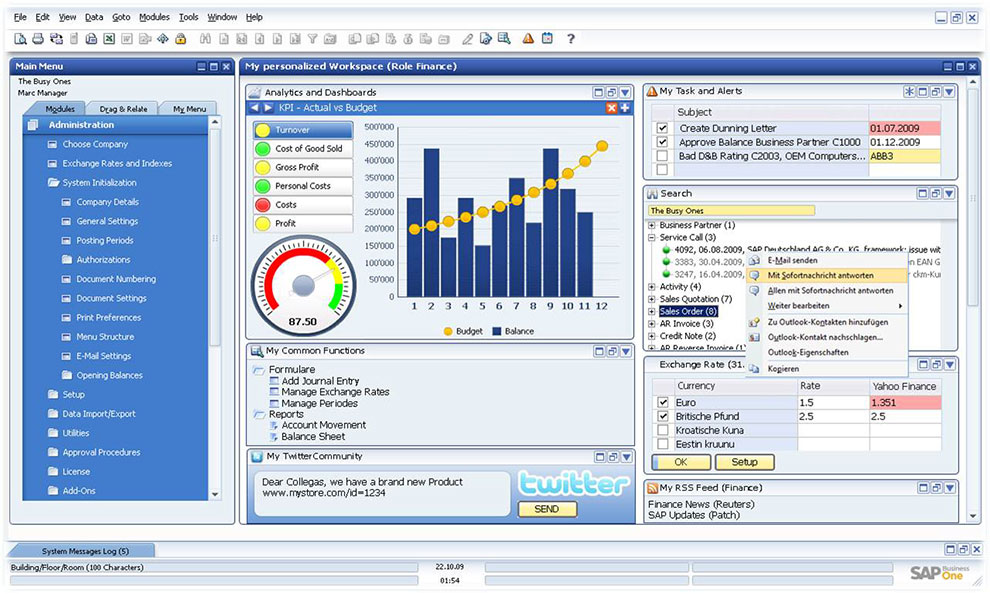
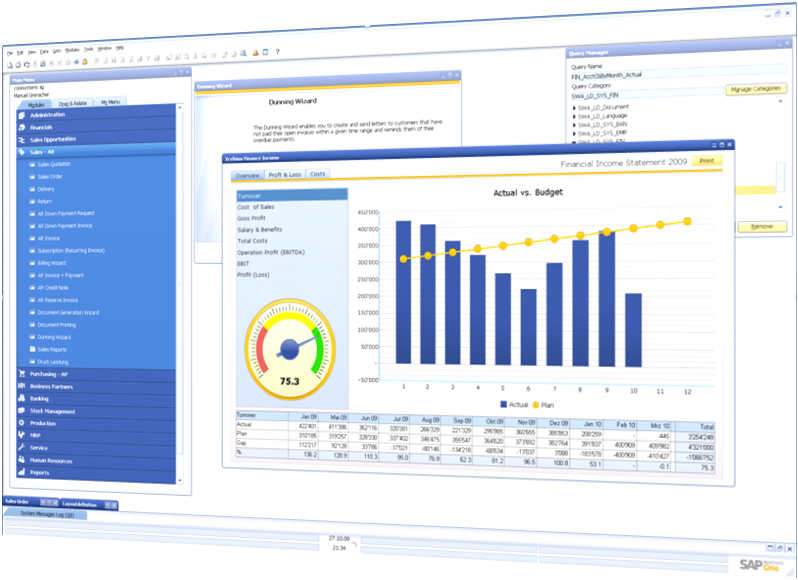
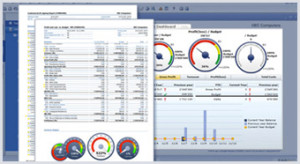
One of the most exciting things that have come about in the last few years is the advent of highly informational analytics.  For years data has been collected by Accounting and Business automation systems, but only recently have we reached the level of processing power that could ‘Crunch’ that data and turn it into meaningful analytics, dashboards, charts and graphs.  Especially with the new SAP HANA solution, getting analytical data has become both possible, but very fast, efficient and highly configurable.

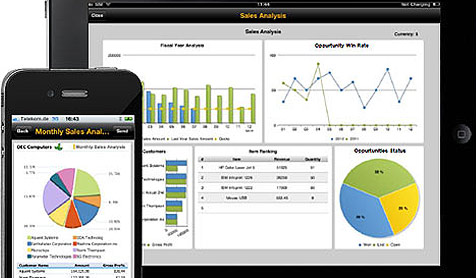
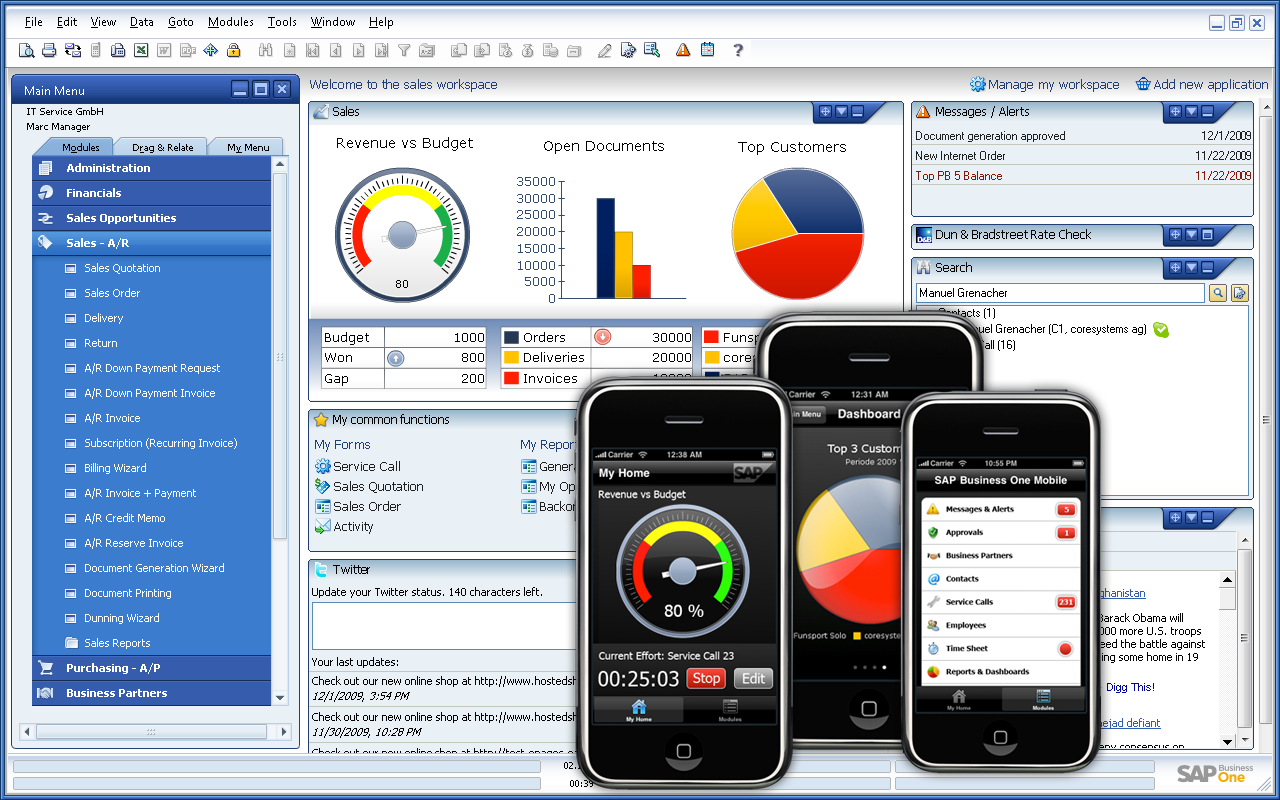
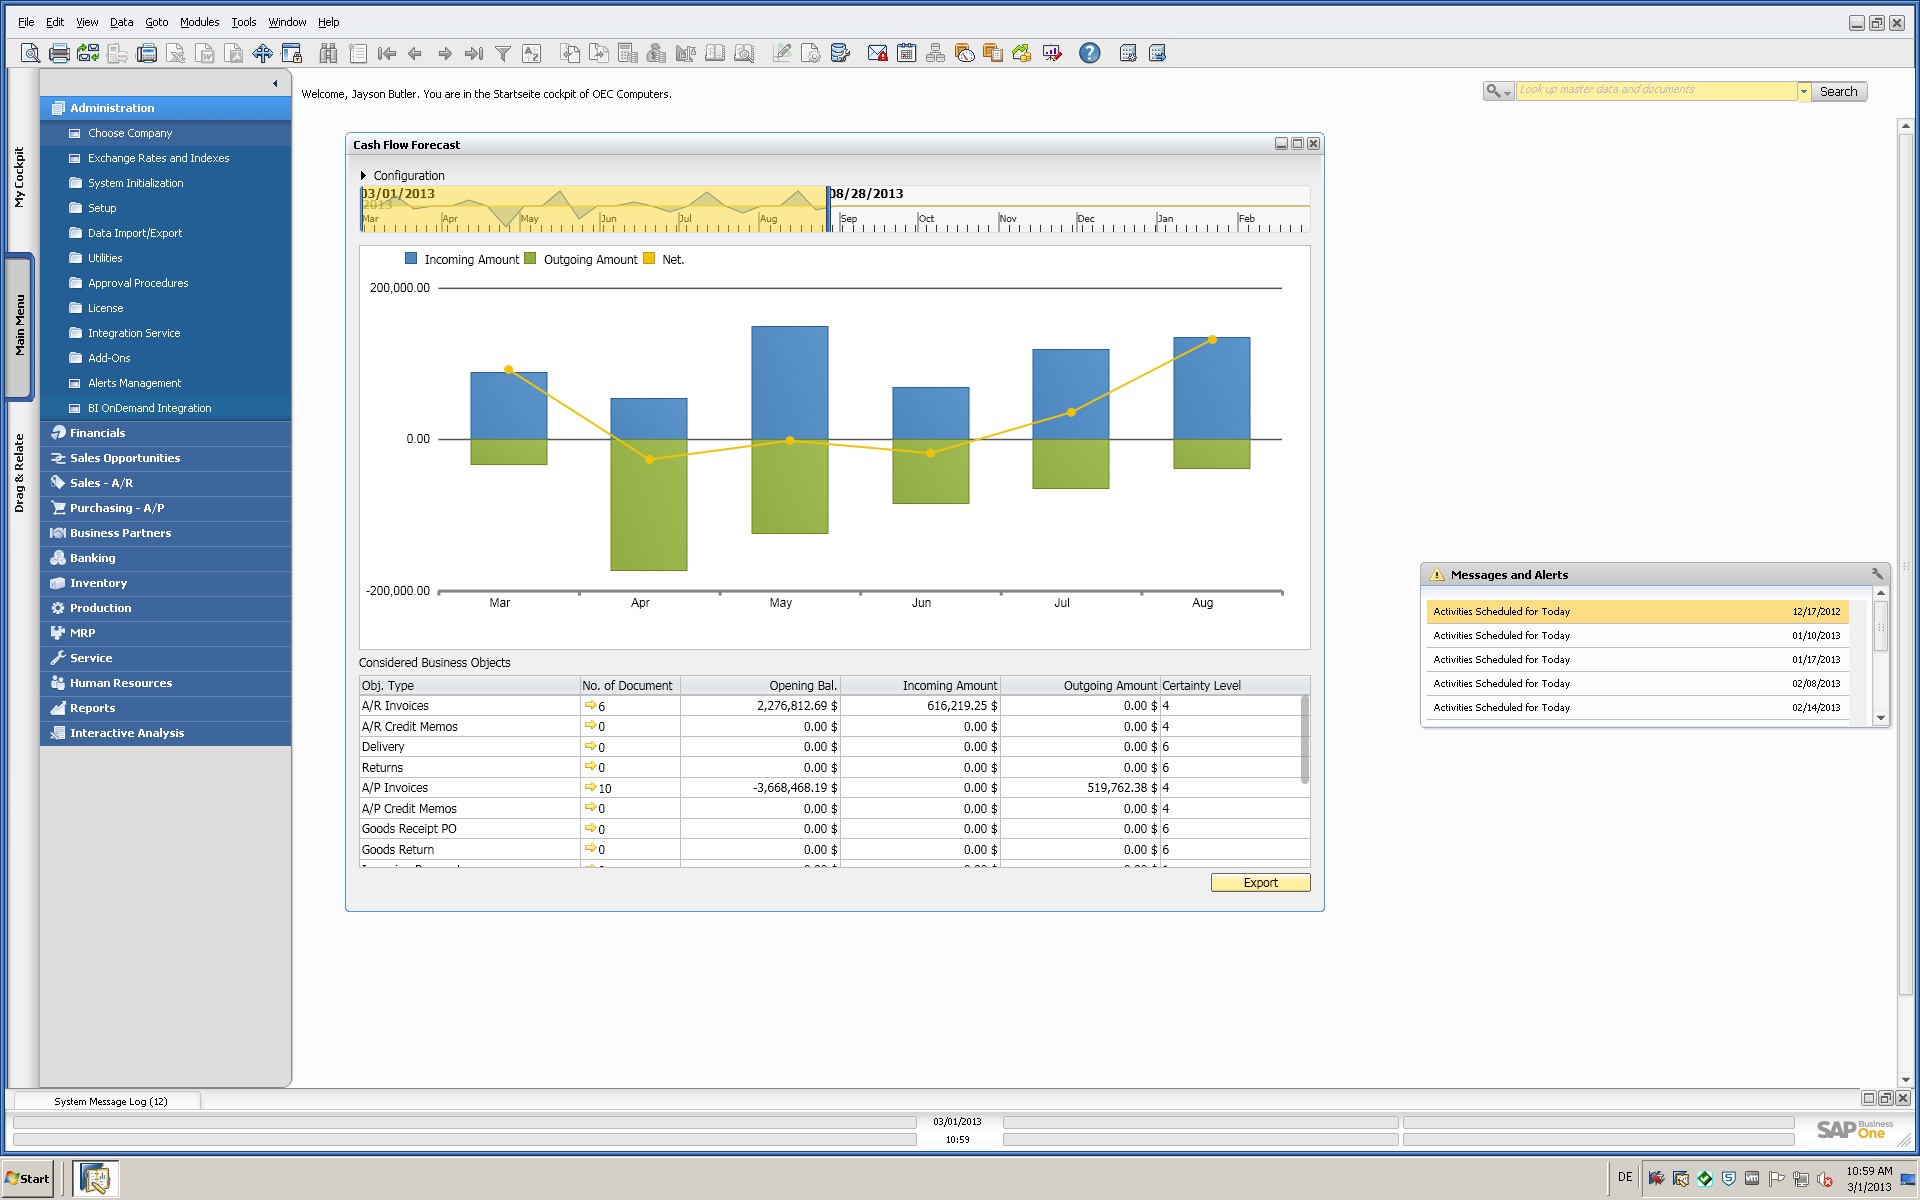
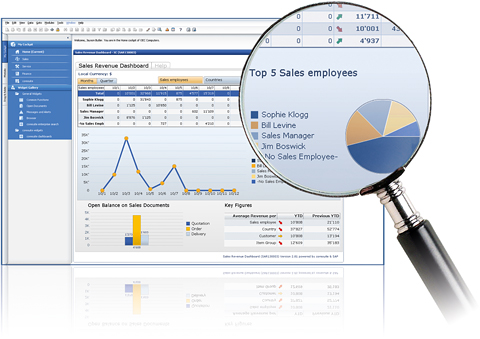
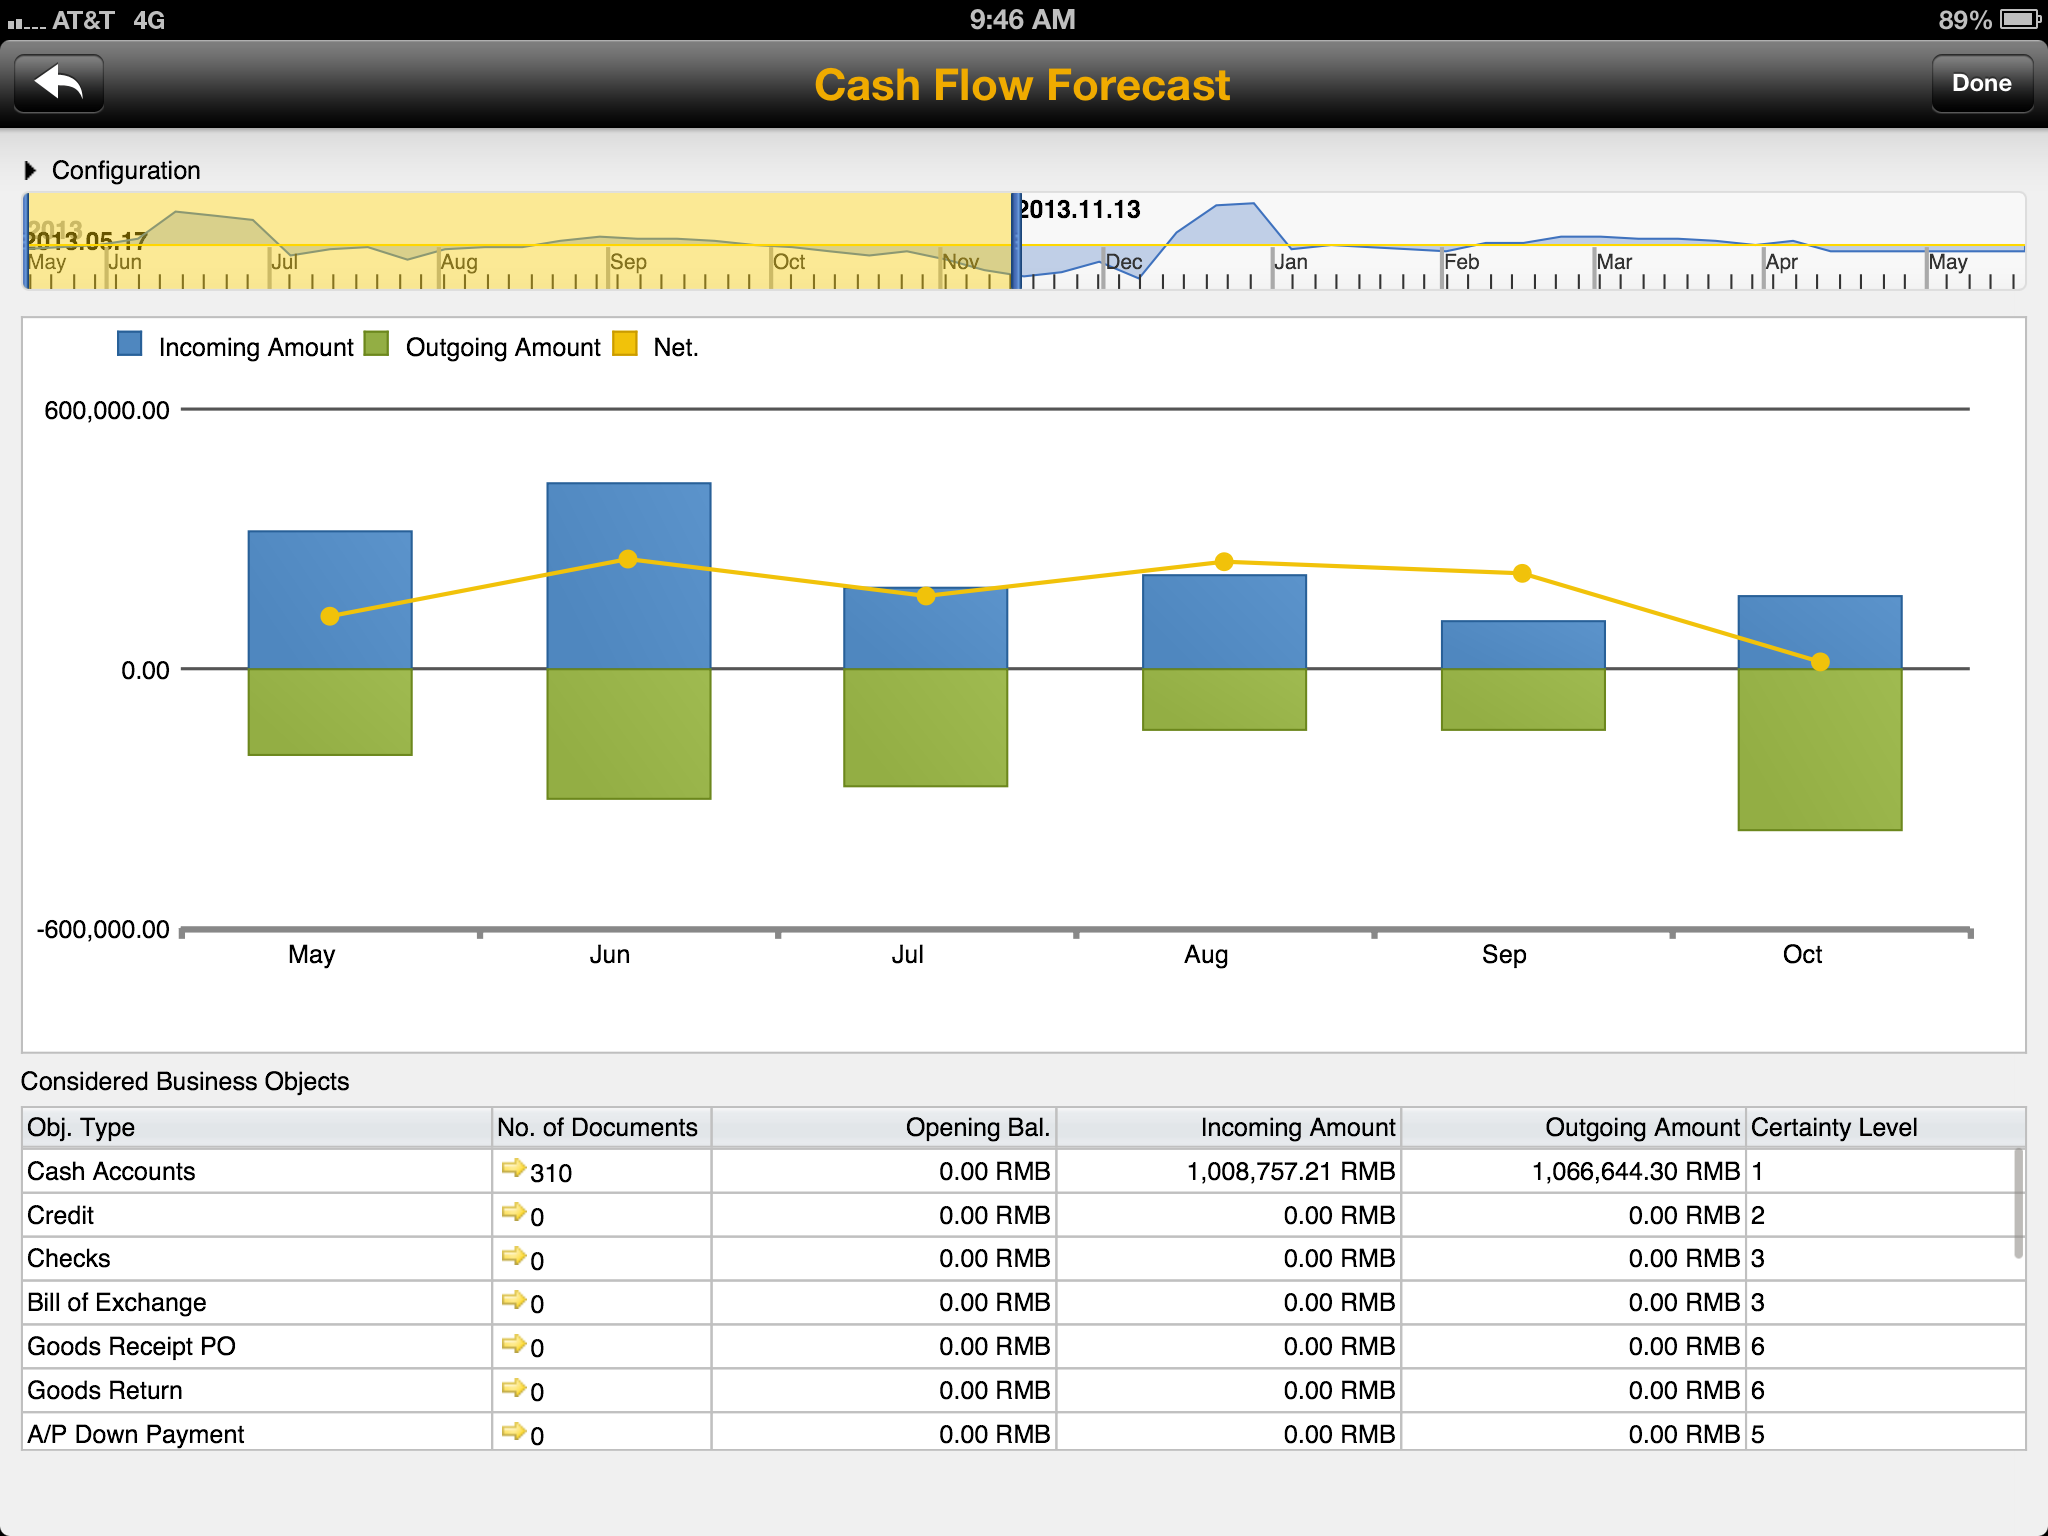
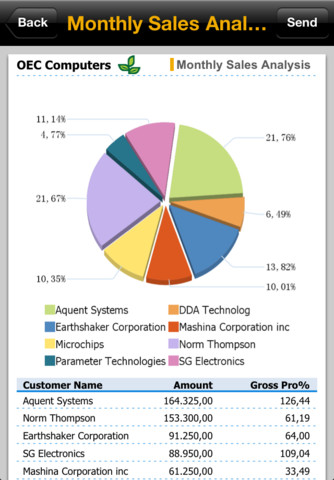
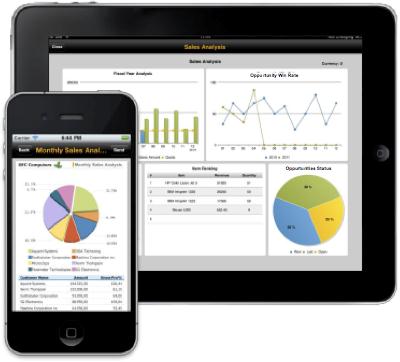
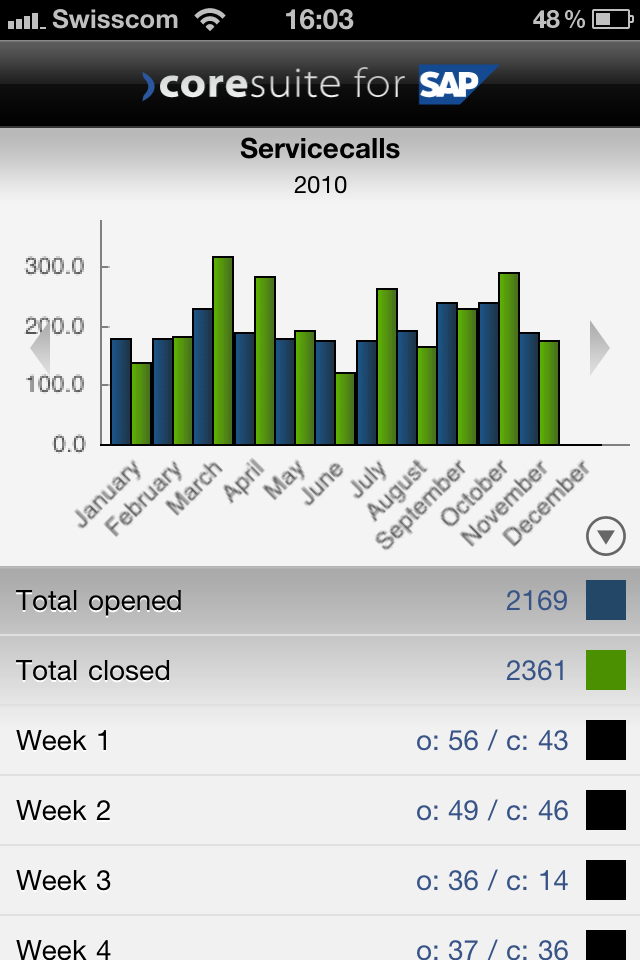
Whether it is Sales by Region by Date Range for a Sales person, or a visual display of corporate cash flow across countries of the world, the SAP HANA solution can provide these dashboards and KPI’s ( Key Performace Indicators ) in “Real-Time”!  No more waiting for the IT department to develop reports or the Finance to export and blend data into Excel.

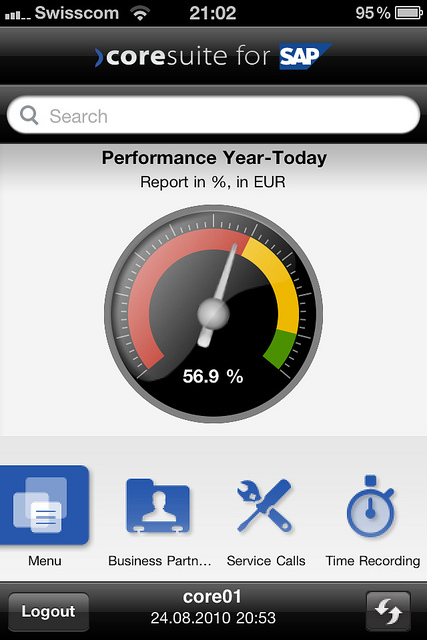
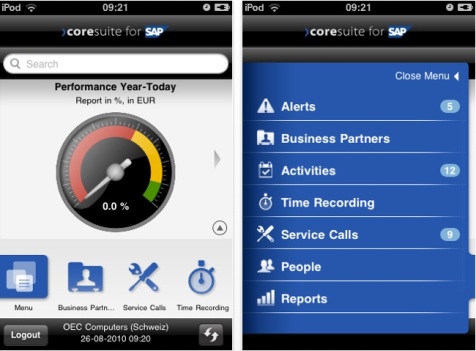
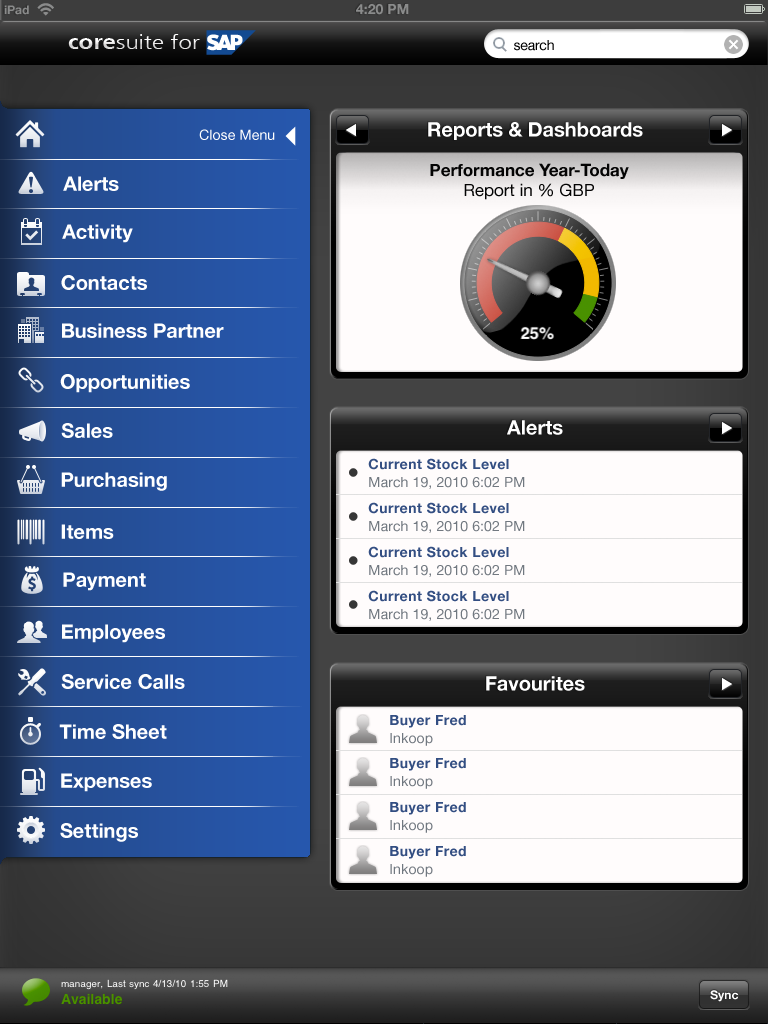
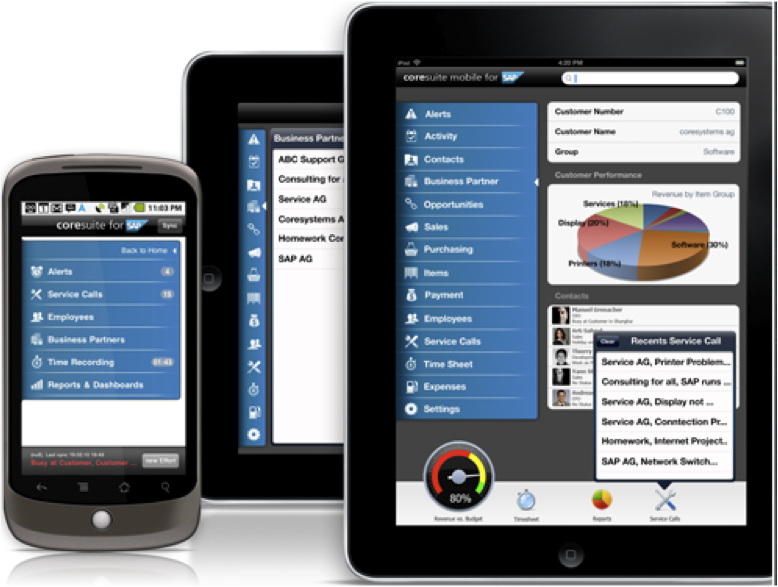
Owners, Managers and those who need it can get theses dashboards on their electronic devices at any time they choose, which in some cases can mean that critical decisions may be made to increase productivity and profitability.  Get Better Visibility and Better Results, Call Cornerstone TODAY at 813-321-1300.

Screenshots: Analytics & Dashboards

Contact Us to Learn More

Get a live demo and see how we can help make your business data more visible and useful:

Contact Us

sapbusinessone_workspace_with_3iphone

Key Features

  • Access data from multiple sources, create new reports, and customize existing ones with minimal IT overhead
  • Get visually rich and interactive reports with built-in Adobe Flash and Adobe Flex
  • Export reports to electronic formats that best fit your business needs and gives you lots of flexibility for sharing them
  • Gather data from across the company and generate timely reports
  • Distribute information to those who need it and provide access to it anywhere and anytime
  • Control access to sensitive business data
  • View and export reports to Adobe PDF, Microsoft Word, Microsoft Excel, RTF, and XML files
  • Use on-report sorting, filtering, and reformatting without having to requery the database
  • Access key data via preconfigured dashboards
  • Drill down into transactional details
  • Share reports by e-mail, fax, electronic file transport
  • All reports are print-friendly
  • Publish reports to the web
  • Assign access rights (control who sees the report)
  • Access reports even without an internet connection
  • Pre-built dashboard
  • Interactive drill-down functionality
  • Comes w/ loads of pre-built reports
  • Reports are easy to customize
  • Easy to understand, visual layouts
  • Cross-tabs for rapid reporting